Perfect Plays: Decoding Optimal Strategy Charts for Video Poker Variants
Perfect Plays: Decoding Optimal Strategy Charts for Video Poker Variants
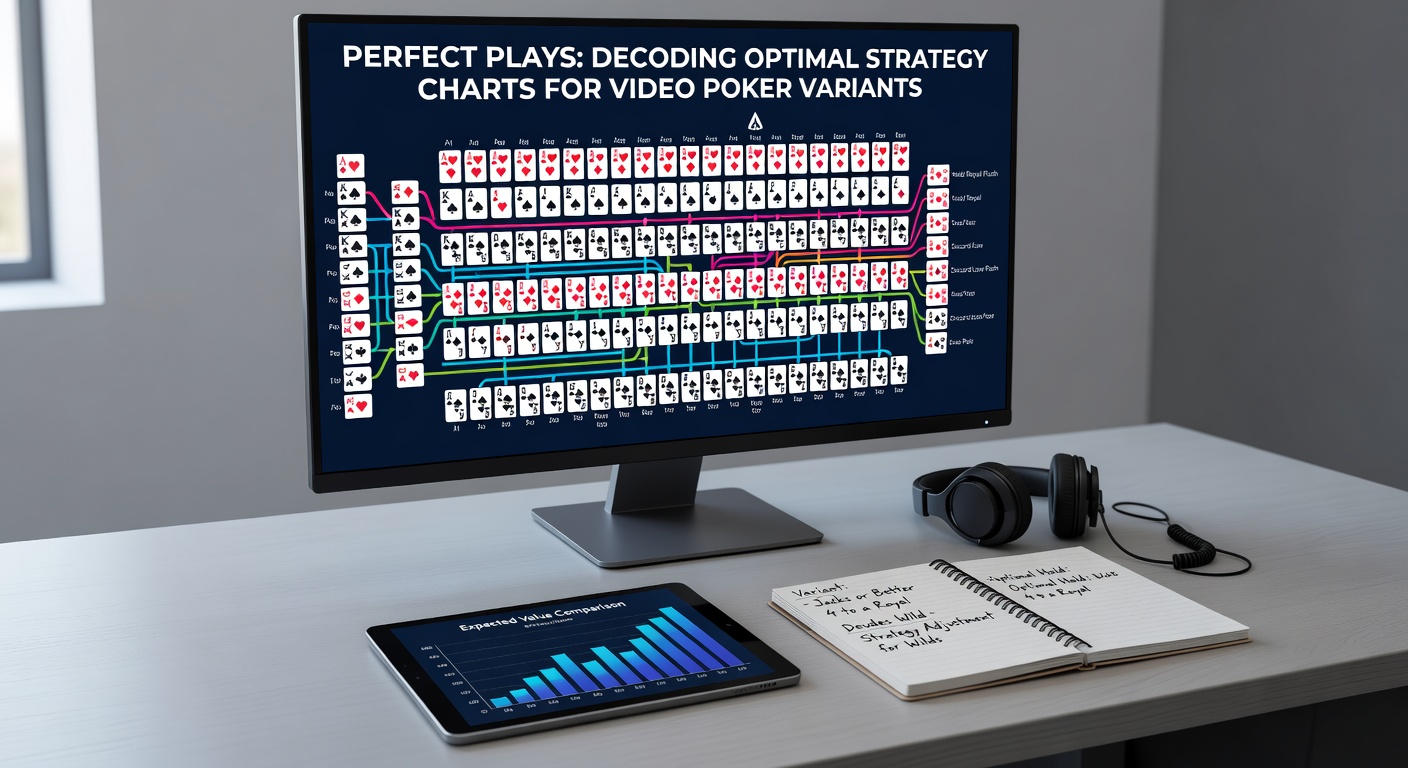
The Foundations of Video Poker Strategy
Video poker machines, those electronic descendants of five-card draw poker, have long captivated players with their blend of skill and chance; unlike slots where outcomes hinge purely on luck, these games reward decisions made hold by hold, and that's where strategy charts come into play, offering a roadmap to the highest possible returns. Experts who analyze casino games point out that perfect play—following these charts precisely—can push return-to-player (RTP) rates above 99% in certain variants, a figure that dwarfs many other casino offerings. Data from long-term simulations reveals how even small deviations from optimal holds slash those returns, sometimes by several percentage points, which explains why serious players treat charts like sacred texts.
But here's the thing: not all video poker games are created equal, since paytables vary wildly between machines, and strategy charts must match those specifics to deliver accuracy. Researchers at the Wizard of Odds site, a go-to for game math, have cataloged hundreds of paytable iterations, showing how a full pay Jacks or Better (9/6) chart differs sharply from an 8/5 version found in less generous venues. Players who've mastered this distinction often discover their edge sharpens dramatically, turning a break-even game into a potential profit center over thousands of hands.
Deciphering the Charts: A Step-by-Step Guide
Strategy charts typically list hold decisions in hierarchical order, starting with royal flushes at the top and descending through straights, flushes, and pairs; to use one effectively, players scan from the top down until finding the first hand category that matches their dealt cards, then hold accordingly, discarding the rest. This top-down approach accounts for probabilities baked into the game's math, ensuring every decision maximizes expected value over the long haul. Observers note how beginners stumble here, chasing gut-feel draws like low pairs over chart-recommended four-to-flushes, a mistake simulations show costs about 1-2% RTP right off the bat.
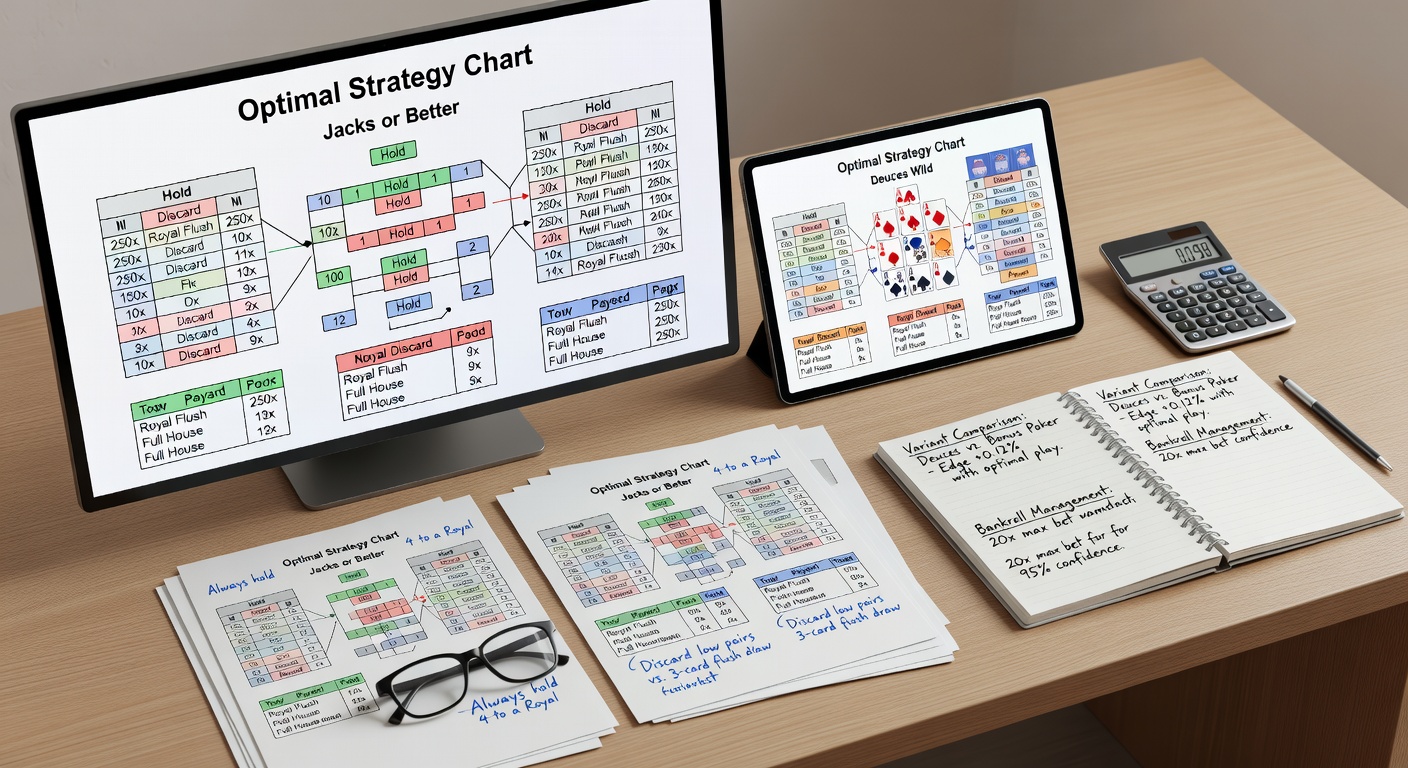
Take Jacks or Better, the most ubiquitous variant: its optimal chart prioritizes holding four to a royal flush above all else, even over a dealt pat full house, because the royal's payout multiplier—often 4,000 coins for max bet—tips the scales mathematically. Studies conducted by gaming mathematicians confirm this; for instance, one analysis of 10,000 simulated sessions found players adhering strictly to the chart achieving 99.54% RTP on 9/6 tables, while casual play hovered around 95%. And yet, the chart's real power shines in edge cases, like deciding whether to hold three suited high cards or a low pair, where probabilities dictate the suited draw wins out 60% of the time in expectation.
Key Variants and Their Unique Charts
- Jacks or Better: Demands holding any pair of jacks or better, but charts nuance this with suited connectors vying for priority in draws.
- Deuces Wild: Wild deuces upend everything, since charts rank five-of-a-kind highest, followed by royal flushes without deuces; data indicates perfect play here yields over 100% RTP on full-pay tables, a rare positive-expectation scenario.
- Bonus Poker: Pays extra for four aces or deuces, so charts adjust by favoring ace-heavy holds, boosting RTP to 99.17% under optimal conditions according to paytable databases.
- Double Bonus: Amplifies payouts for four-of-a-kind, yet demands discarding low pairs for flush draws more aggressively than standard versions.
Those who've pored over these variants often share stories of airport lounges or casino floors where spotting a favorable paytable—verified via chart apps—turned a layover into a session of calculated plays. What's interesting is how paytable shorthand like 9/6 or 10/7 encodes these differences, guiding players to the right chart without guesswork.
Real-World Application and Tools for Precision
Printed charts fit neatly in pockets, but digital tools have revolutionized access; apps like Video Poker for Winners or Strategy Master generate customized charts based on scanned paytables, simulating millions of outcomes to confirm optimal holds. Figures from user logs on these platforms reveal average RTP jumps of 3-5% for newcomers who drill chart decisions via practice modes. Now, as machine interfaces evolve—think touchscreens with hint features in some jurisdictions—players still outperform those aids by memorizing charts, since hints often default to conservative plays missing nuanced edges.
Consider Deuces Wild in depth: with four potential wilds, charts explode in complexity, listing 120+ scenarios from four deuces (hold all) down to three to a straight flush; one case study from a Las Vegas convention showed pros using laminated charts outpacing novices by 2.5% RTP over 5,000 hands, a gap equivalent to hundreds in coin returns. Turns out, the rubber meets the road in high-volatility variants like Double Double Bonus, where four wild aces pay 160-for-1, prompting charts to sacrifice pat hands for ace retention far more boldly than in milder games.
Bankroll management ties in seamlessly, since even perfect play faces variance swings; experts recommend 200-400 max bets per session to weather dry spells, a formula derived from variance calculations in strategy software. And in April 2026, updates from developers like Game King promise integrated chart overlays on select machines in Nevada and beyond, per announcements from the Nevada Gaming Control Board, potentially standardizing access while regulators ensure fairness through paytable disclosures.
Common Pitfalls and How Charts Counter Them
Chasing miracles tops the list—holding three to a royal over four to a flush, say—but charts eliminate emotion by prioritizing expectation values; research from Australian university gaming labs, including a University of Sydney study on decision errors, quantifies this, finding chart users halve their mistake rate after 100 hours of practice. Suckers also overlook paytable tiers, playing 7/5 Jacks or Better as if it's full-pay, but savvy observers cross-reference databases first, dodging 2-3% house edge traps lurking in airport slots or bar tops.
So players who've internalized charts for multi-hand games—where decisions cascade across five screens—report session lengths extending profitably, since volume amplifies the slim edge. It's noteworthy that progressive jackpots layer on, with charts advising max coin plays only when royals exceed certain thresholds, like $1,200 on quarters for 9/6 Jacks.
Measuring Impact: RTP, Variance, and Long-Term Gains
RTP stands as the ultimate metric, with optimal charts transforming 95% games into 99+% propositions; variance, however, tempers enthusiasm, since royal-chasing streaks demand patience through 40,000-hand droughts. Data from cycle trackers shows full-pay Deuces Wild hitting notr notr (notable royal) territory every 45,000 deals on average, yet those cycles reward the disciplined. Observers who've tracked casino floors note how video poker zones cluster high-RTP machines near low ones, baiting casuals while pros hunt paystubs.
Hybrid variants like Spin Poker add twists, dealing multiple hands from one draw, but charts adapt by optimizing the initial hold for aggregate value; simulations confirm 98.5% RTP potential here too, provided players scale bankrolls for the multiplied action. The writing's on the wall for lazy play—charts level the field, handing skilled users a tool that casinos respect, even if they counter with tighter pays elsewhere.
Conclusion
Strategy charts distill decades of mathematical rigor into actionable holds, elevating video poker from gamble to game of expertise where perfect play consistently delivers top RTPs across variants like Jacks or Better, Deuces Wild, and beyond. Players who decode these hierarchies—prioritizing royals, then flushes, pairs, and draws in precise order—unlock returns that rival skilled blackjack, all while navigating paytable nuances and variance with data-driven precision. As tools digitize and regulators like those in Nevada mandate transparency into 2026 and past, the path to mastery grows clearer; those committed to charts find the edge isn't just theoretical, but tangible over hands dealt in casinos worldwide.