Decision Trees and Player Strategies in Multi-Table Tournaments Across Online Poker Networks
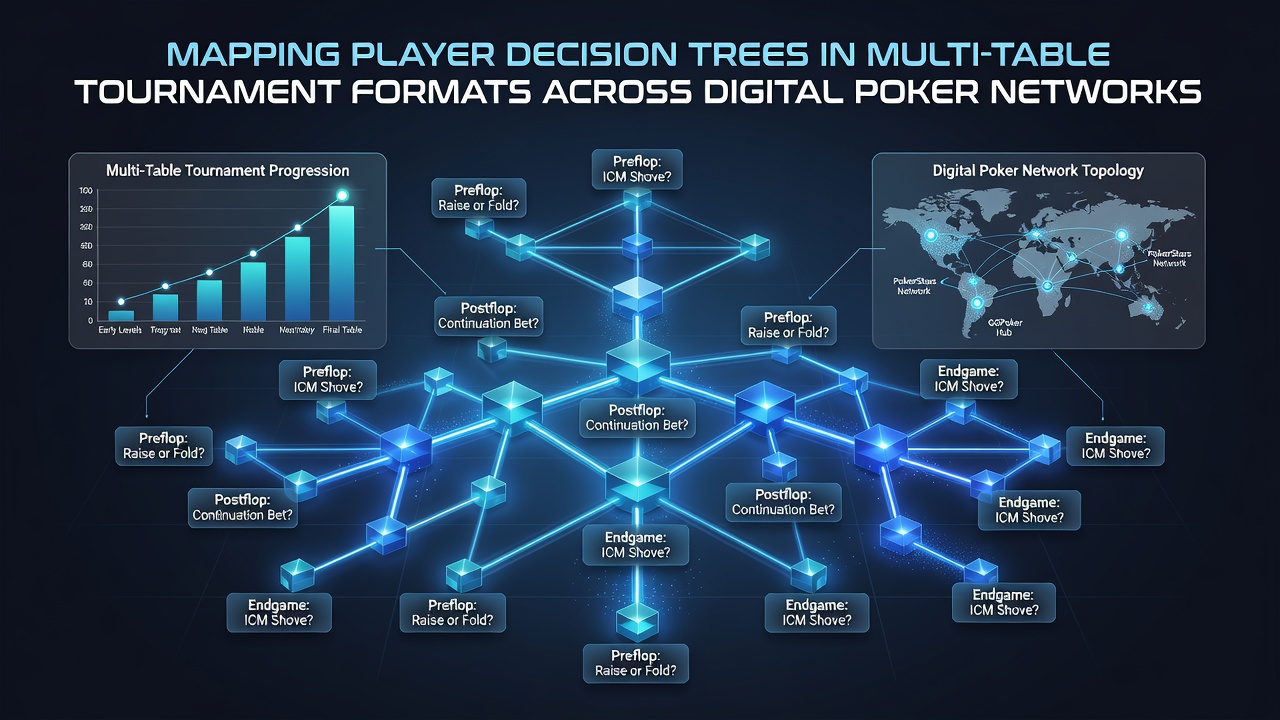
Digital poker networks host millions of multi-table tournament entries each year and researchers continue to refine methods for mapping player decision trees in these environments. These trees represent sequences of choices that participants face from early levels through final tables where stack sizes, blind structures, and payout ladders influence each action. Observers note that software tools now parse hand histories from major platforms to construct branching diagrams that reveal patterns in raise frequencies, fold rates, and all-in decisions across thousands of similar spots.
Core Elements of Decision Tree Construction
Analysts begin by extracting variables such as position, stack depth, and prior action sequences from tournament data logs. They assign probabilities to each branch based on observed frequencies rather than theoretical models alone. This approach allows the resulting trees to reflect real-world tendencies that emerge when players navigate ICM pressure during late stages. Studies from academic groups show that incorporating time stamps from digital networks improves accuracy because decisions made under shorter time banks differ measurably from those taken with extended consideration periods.
Software packages commonly used for this work include custom scripts built on Python libraries that interface directly with poker tracking databases. These tools generate visual representations where each node displays not only the action taken but also the distribution of outcomes that followed across comparable fields. Data aggregated from networks operating under oversight from bodies such as the Nevada Gaming Control Board demonstrates consistent differences between recreational and professional cohorts in how they adjust continuation bet sizing as tournament stages progress.
Application Across Multi-Table Formats
Multi-table tournaments present unique mapping challenges because payout structures create non-linear incentives that shift dramatically once the money bubble approaches. Decision trees must therefore expand to include bubble factors and pay-jump considerations that rarely appear in cash game models. Platforms record millions of hands annually and these datasets enable segmentation by buy-in level, field size, and average stack depth. One study revealed that players facing sub-twenty big blind stacks in the middle stages fold to three-bets at rates 12 percent higher than their early-stage counterparts when similar stack depths occur before antes enter play.
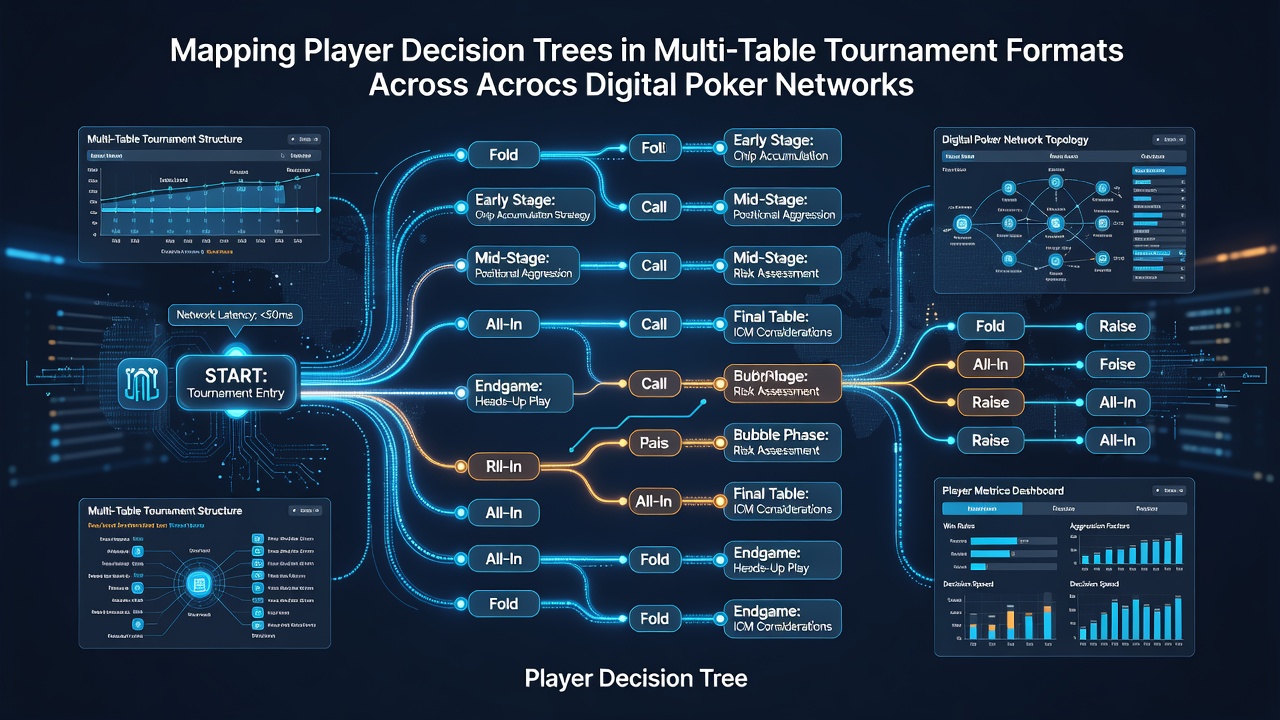
Networks operating across multiple jurisdictions supply additional layers of information because regulatory differences affect available game variants and speed formats. European operators, for instance, often run turbo structures with shorter blind intervals while North American sites maintain standard pacing. Mapping exercises that compare these formats reveal faster escalation in aggression metrics once average stacks fall below thirty big blinds. Figures released by industry research groups indicate that decision trees calibrated on one region’s data require recalibration before they accurately predict behavior on networks governed by separate authorities such as those in Australia or Canada.
Data Sources and Analytical Techniques
Hand histories supplied by networks undergo filtering to remove bots and multi-account patterns before tree construction begins. Machine learning models then cluster similar decision nodes to identify strategic groups rather than treating every micro-variation as unique. This clustering reduces computational load while preserving the most predictive branches. Researchers at institutions focused on game theory applications have published methods that integrate equity calculations directly into the tree structure so each path carries both observed frequency and theoretical value estimates.
As of June 2026 several networks introduced enhanced logging features that capture not only final actions but also the timing and sizing of intermediate slider movements during betting rounds. These granular records allow analysts to distinguish between deliberate choices and default clicks, adding another dimension to existing trees. The resulting models show measurable divergence in late-position defense frequencies between players who pause before acting and those who act within two seconds across repeated similar spots.
Conclusion
Mapping player decision trees in multi-table tournament formats supplies networks and researchers with structured representations of strategic behavior drawn from actual digital play. Continued refinement of data collection methods and analytical tools supports more precise segmentation of participant tendencies across varying tournament conditions. Regulatory bodies outside the United Kingdom continue to monitor these developments as part of broader oversight of online gaming integrity and player protection frameworks.